The pointlike Maximum-likelihood Fitting Package For Analysis Fermi-LAT Data
01 Feb 2013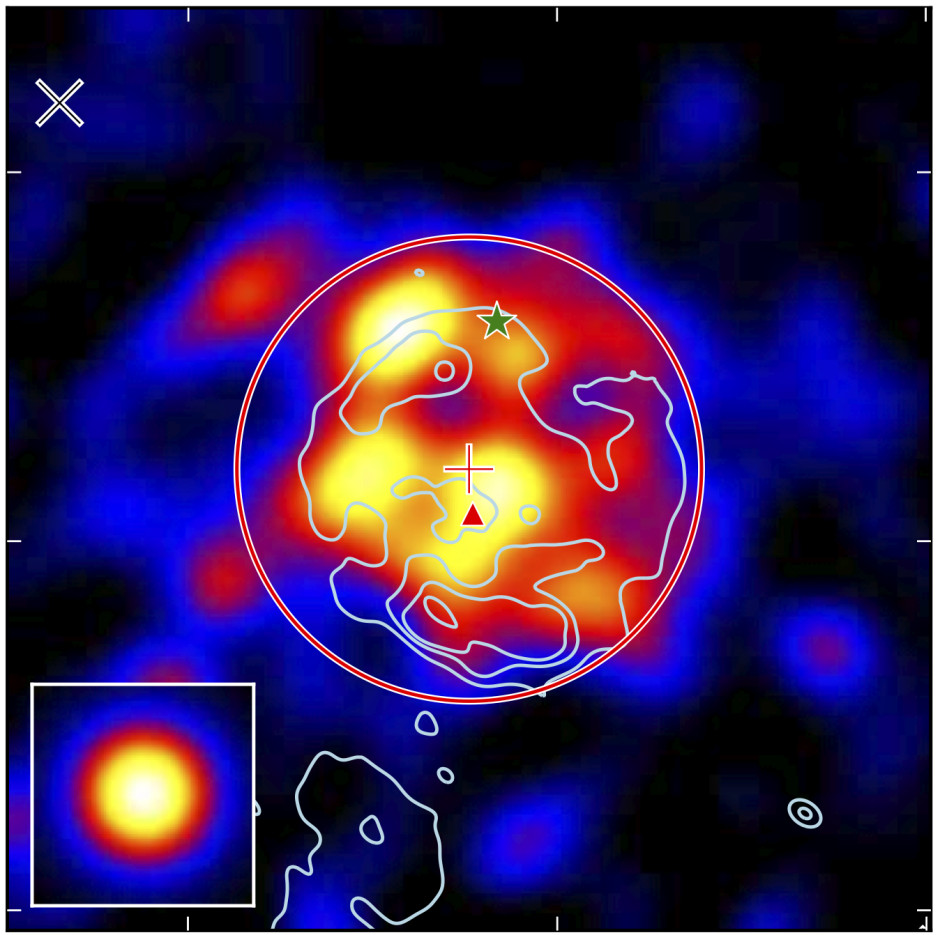
During graduate school, I was involved with the development of pointlike, a package for fitting data observed by the Fermi Gamma-ray space telescope.
Design
Pointlike was designed from the ground up with flexibility in mind:
- high-level code written in python with an object-oriented design.
- Interface with underlying C++ libraries to handle HEALPix and fits files. These libraries were wrapped with SWIG
- Leverage as much as possible numpy, scipy, matplotlib, and pywcsgrid2.
- python interface allows great flexibility and adaptability.
Interface
The objects and functions described below have a variety of parameters that modify their behavior. The easiest way to explore pointlike’s features is interactively in ipython using the question mark functionality:
$ ipython
In [1]: roi.print_summary?
Type:             instancemethod
Base Class:       <type 'instancemethod'>
String Form:   File:             /nfs/farm/g/glast/u35/ReleaseManagerBuild/redhat5-x86_64-64...
Definition:       roi.print_summary(roi, sdir=None, galactic=False, maxdist=5...
Docstring:
    formatted table point sources positions and parameter in the ROI,
        followed by summary of diffuse names, parameters values.
        values are followed by a character to indicate status:
            blank: fixed
            ?      sigma=0, not fit yet
            !      relative error<0.1
            *      otherwise
    Parameters
    ----------
         sdir : SkyDir, optional, default None for center
               for center: default will be the first source
         galactic : bool, optional, default False
             set true for l,b
         maxdist : float, optional, default 5
             radius in degrees
...
Build the ROI
To perform a Fermi analysis, first create a DataSpecification object. This defines the Fermi data that will be used:
from uw.like.pointspec import DataSpecification
ds=DataSpecification(binfile="binned.fits",
                     ltcube="ltcube.fits",
                     ft1files=["ft1_part1.fits","ft1_part2.fits"],
                     ft2files="ft2.fits")
Next, set the binning and the instrument response function with the SpectralAnalysis object:
## First, define the center of your desired analysis region
from skymaps import SkyDir
center=SkyDir(086.1111,-38.1838,SkyDir.GALACTIC)

from uw.like.pointspec import SpectralAnalysis
sa=SpectralAnalysis(ds,
                    binsperdec=4,
                    emin=100,
                    emax=100000,
                    irf="P6_V3_DIFFUSE",
                    roi_dir=center,
                    maxROI=10,
                    minROI=10)
Assuming you have a gtlike-style XML file defining the sky model, create the region of interest (ROI):
roi=sa.roi(xmlfile="model.xml")This ROI object can be used to perform many common Fermi analyses.
Basic Fitting
To print a summary of the sources in your model:
roi.print_summary()This produces the output
----------------------------------------------------------------------------
         Nearby sources within 5.0 degrees
name               dist       l       b  TS  flux8   index  beta    cutoff
2FGL J1837.3-0700c  0.2  25.084   0.132  48   2.08*  1.60*
2FGL J1836.8-0623c  0.6  25.569   0.324  13   0.45*  0.02*  0.22*   100.36*
2FGL J1834.7-0705c  0.7  24.715   0.503  46  33.11*  2.35*
2FGL J1839.3-0558c  1.0  26.080   0.229  21   2.29*  0.10*  0.56*   553.51*
2FGL J1834.3-0848   2.0  23.143  -0.242  18   1.45*  0.45*  0.19*    74.40*
2FGL J1841.2-0459c  2.2  27.323  -0.011   1  10.52   2.47   0.22   1940.48
----------------------------------------------------------------------------
        Diffuse sources
----------------------------------------------------------------------------
ring_2year_P76_v0.fits      0.74!      0.90!
isotrop_2year_P76_source_v0.txt      0.00*
----------------------------------------------------------------------------
-> Total (not negative) logLikelihood =  -58282.6030786
To perform a spectral fit:
roi.fit(use_gradient=False)This produces the output
..... performing likelihood maximization ... Optimization terminated
Current function value: -259556.745008 Iterations: 229
Function evaluations: 379
Function value at minimum: -259556.75
Attempting to invert full hessian ...
To compute the test statistic for the detection of the source:
ts=roi.TS(which="name")To compute the log likelihood:
ll=-1*roi.logLikelihood(roi.parameters())To fit the position of a source:
roi.localize(which="source_name", update=True)update=True causes the position of the source to be updated after the position is fit.
To print the elliptical fit uncertainty:
roi.print_ellipse()This produces the output
       ra     dec     a     b     ang   qual
  258.008 -39.635 0.061 0.031 25.5596 7.7114   50.65
The ellipse’s major axis is a, minor axis is b, orientation angle is ang (measured east of celestial north), and elliptical fit quality is qual.
To get the ellipse values:
ellipse=roi.get_ellipse()Plotting
Making plots in pointlike is easy.
To plot the spectral energy distribution:
roi.plot_sed(which="name",filename='sed.pdf')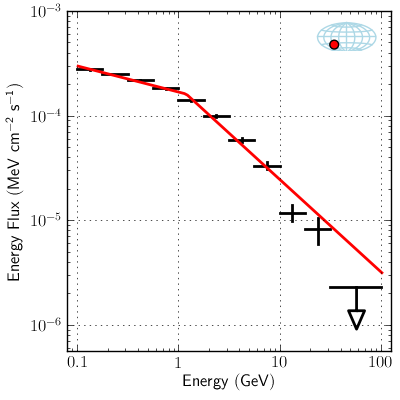
To make a residual test statistic map:
roi.plot_tsmap(filename='tsmap.pdf')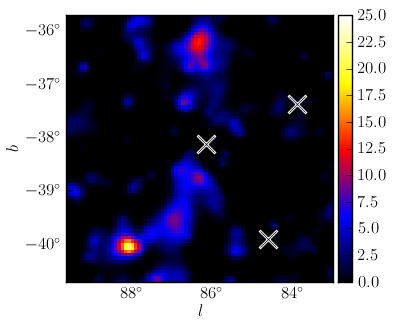
To plot a model counts map, counts map, and residual counts map:
roi.plot_counts_map(filename='counts.pdf')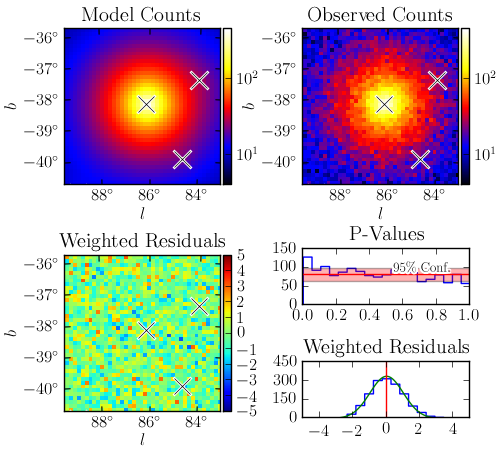
To plot a smoothed diffuse-emission-subtracted counts map:
roi.plot_sources(which='name',
                 filename='source.png',
                 kernel_rad=0.1)
Pointlike without XML
You can build a pointlike ROI without a [gtlike-style XML file] (http://fermi.gsfc.nasa.gov/ssc/data/analysis/scitools/source_models.html) by programmatically specifying the background model and source catalog:
from uw.like.roi_catalogs import Catalog2FGL
from uw.like.pointspec_helpers import get_default_diffuse
roi = sa.roi(
  # standard gal + iso diffuse
  diffuse_sources=get_default_diffuse(
    diffdir='/path/to/diffuse/',
    gfile='ring_24month_P76_v1.fits',
    ifile='isotrop_21month_P76_source_v2.txt'),

  # load in 2FGL automatically
  catalogs = Catalog2FGL("gll_psc_v05.fit",
    latextdir='gll_psc_v05_templates',
    free_radius=2),

  # add additional point sources
  point_sources=[...],
)
Modifying the Sky Model
Pointlike exposes functionality to easily modify the sky model of an ROI.
To create a new spectral model:
from uw.like.Models import *
PowerLaw(norm=1e-11, index=2.0, e0=1e3)
PowerLawFlux(int_norm=1e-7, index=2.0,emin=100, emax=1e6)
BrokenPowerLaw(norm=1e-11, index_1=2.0,
               index_2=2.0, e_break=1e3)
BrokenPowerLawFlux(int_flux=1e-7, index_1=2.0,
                   index_2=2.0 ,e_break=1e3,
                   emin=100, emax=1e6)
BrokenPowerLawCutoff(norm=1e-11,index_1=2,
                     index_2=2,e_break=1e3)
SmoothBrokenPowerLaw(norm=1e-11,index_1=2.0,
                     index_2=2.0, e_break=1e3,beta=.1)
DoublePowerLaw(norm=5e-12, index_1=2,
               index_2=2, ratio=1)
LogParabola(norm=1e-11, index=2, beta=1e-5, e_break=2e3)
ExpCutoff(norm=1e-11, index=2, cutoff=2.0, 2e3)
ExpCutoffPlusPL(norm1=1e-11,index1=2,cutoff1=2e3,
                norm2=1e-12,index2=1.5)
AllCutoff(norm=1e-11,cutoff=1e3)
PLSuperExpCutoff(norm=1e-11,index=2,cutoff=2e3,b=1)
Constant(scale=1)
To create a new point source:
from uw.like.pointspec_helpers \
    import PointSource
from uw.like.Models import PowerLaw

ps=PointSource(name='source',
    skydir=SkyDir(l,b,SkyDir.GALACTIC),
    model=PowerLaw(norm=1e-11,
                   index=2))
To add or delete a point source in the ROI:
roi.add_source(ps)
roi.del_source(which='name')
To modify the spectral model or position of a source in the ROI:
roi.modify(which='name', model=PowerLaw(...))
roi.modify(which='name', skydir=SkyDir(...))
To zero or unzero a source:
roi.zero_source(which='source')
roi.unzero_source(which='source')
To freeze or unfreeze a source:
roi.modify(which='source_name',free=False)
roi.modify(which='source_name',free=True)
Iterative Analyses
One of the major benefits of pointlike is that the underlying functions can be used in more complicated programs.
For example, to delete all insignificant sources:
from math import degrees
for source in roi.get_sources():
    if roi.TS(which=source) < 9:
        roi.del_source(source)
Or to localize all sources within 2 degrees of the center of the ROI:
from math import degrees
for source in roi.get_sources():
  sd=source.skydir
  dist=degrees(sd.difference(roi.roi_dir))
  if dist < 2:
    roi.localize(which=source,update=True)
File input/output
There are several methods for getting data out of pointlike:
To save a gtlike-style XML file:
roi.toXML('output.xml')To make a gtlike-style results file:
roi.toResults('output.rat')To save out a ds9-style region file:
roi.toRegion('output.reg')To save the entire ROI to a file:
roi.save('roi.dat')To recreate the ROI from another script:
from uw.like.roi_save import load
roi=load('roi.dat')
## play with it some more
...
This loading and saving functionality can be very useful for iterative analyses.
Extended Sources
Pointlike can natively support spatially-extended sources. Pointlike supports the Disk, Gaussian, EllipticalDisk, EllipticalGaussian, SpatialMap, and NFW spatial models.
The gtlike-style XML format for defining an extended source is straightforward:
<source name="ic443" type="DiffuseSource">
  <spectrum type="PowerLaw2">
    <parameter free="1" name="Integral" scale="1.0" value="3e-7" />
    <parameter free="1" name="Index" scale="1.0" value="-2" />
    <parameter free="0" name="LowerLimit" scale="1.0" value="200" />
    <parameter free="0" name="UpperLimit" scale="1.0" value="1e6" />
  </spectrum>
  <spatialModel type="Gaussian">
    <parameter free="1" name="RA" scale="1.0" value="94.3124" />
    <parameter free="1" name="DEC" scale="1.0" value="22.5745" />
    <parameter free="1" name="Sigma" scale="1.0" value="0.18" />
  </spatialModel>
</source>
To fit the extension parameters of an extended source:
roi.fit_extension(which="name")This produces the output
center = [ 258.390d, -39.760d ], ext = [ 0.500d ], logL = 31019.772, dlogL=0.00
 **********
 **    1 **SET PRINT           1
 **********
 **********
 **    2 **SET STR            1
 **********
 NOW USING STRATEGY  1: TRY TO BALANCE SPEED AGAINST RELIABILITY
 PARAMETER DEFINITIONS:
    NO.   NAME         VALUE      STEP SIZE      LIMITS
     1 RA           2.58390e+02  1.00000e-01    2.48390e+02  2.68390e+02
     2 Dec (rotated)   0.00000e+00  1.00000e-01   -1.00000e+01  1.00000e+01
     3 log10(Sigma)  -3.01030e-01  4.00000e-02   -1.00000e+01  4.77121e-01
 **********
 **    3 **SET ERRDEF         0.5
 **********
 **********
 **    4 **SIMPLEX          500        0.05
 **********
 FIRST CALL TO USER FUNCTION AT NEW START POINT, WITH IFLAG=4.
center = [ 258.390d, -39.760d ], ext = [ 0.500d ], logL = 31019.772, dlogL=0.00
 START SIMPLEX MINIMIZATION.    CONVERGENCE WHEN EDM .LT. 0.05
center = [ 258.520d, -39.760d ], ext = [ 0.500d ], logL = 31018.118, dlogL=-1.65
...
setting source to best fit parameters
center = [ 258.461d, -39.907d ], ext = [ 0.551d ], logL = 31024.697, dlogL=4.92
To compute the extension significance of an extended source:
ts_ext=roi.TS_ext(which="name")To create an extended source directly from python:
from uw.like.SpatialModels import *
center=SkyDir(178,3,SkyDir.GALACTIC)

Disk(sigma=0.1,center=center)
NFW(sigma=1,center=center)
Gaussain(sigma=0.1,center=center)
EllipticalDisk(major_axis=0.3,
               minor_axis=0.3, pos_angle=45,
               center=center)
EllipticalGaussian(major_axis=0.3,
                  minor_axis=0.3, pos_angle=45,
                 center=center)
SpatialMap(file='template.fits)
To create a new extended source:
from uw.like.roi_extended import ExtendedSource
from uw.like.Models import PowerLaw
from uw.like.SpatialModels import Disk

spatial=Disk(sigma=0.1, center=SkyDir(l,b,SkyDir.GALACTIC))

spectral=PowerLaw(norm=1e-11, index=2)

es=ExtendedSource(name='extended source',
                  spatial_model=spatial,
                  model=spectral)
To add the extended source to the ROI:
roi.add_source(es)To modify a source’s spatial model:
roi.modify(which='extended_source',
           spatial_model=Disk(sigma=0.1, center=SkyDir(...))
To convert a point source into an extended source:
roi.modify(which='point_source', spatial_model=...)To convert an extended source into a point source:
roi.modify(which='extended_source', skydir=...)References
If you would like to learn more about pointlike:
- There is additional documentation about pointlike on the LAT workbook.
- Matthew Kerr’s PhD Thesis describes the implementation details of pointlike.
- The extended source functionality of pointlike is described in this publication.
- You can view the pointlike source code here.
If you have any questions or comments, please post them below. If you liked this post, you can share it with your followers or follow me on Twitter!